BUS OPERATION MANAGEMENT SYSTEM
We developed an advanced software solution that empowers control room teams in managing bus operations efficiently by consolidating operational data from various systems.
1. MY RESPONSIBILITY
Company wide Collaboration to create an advanced software.
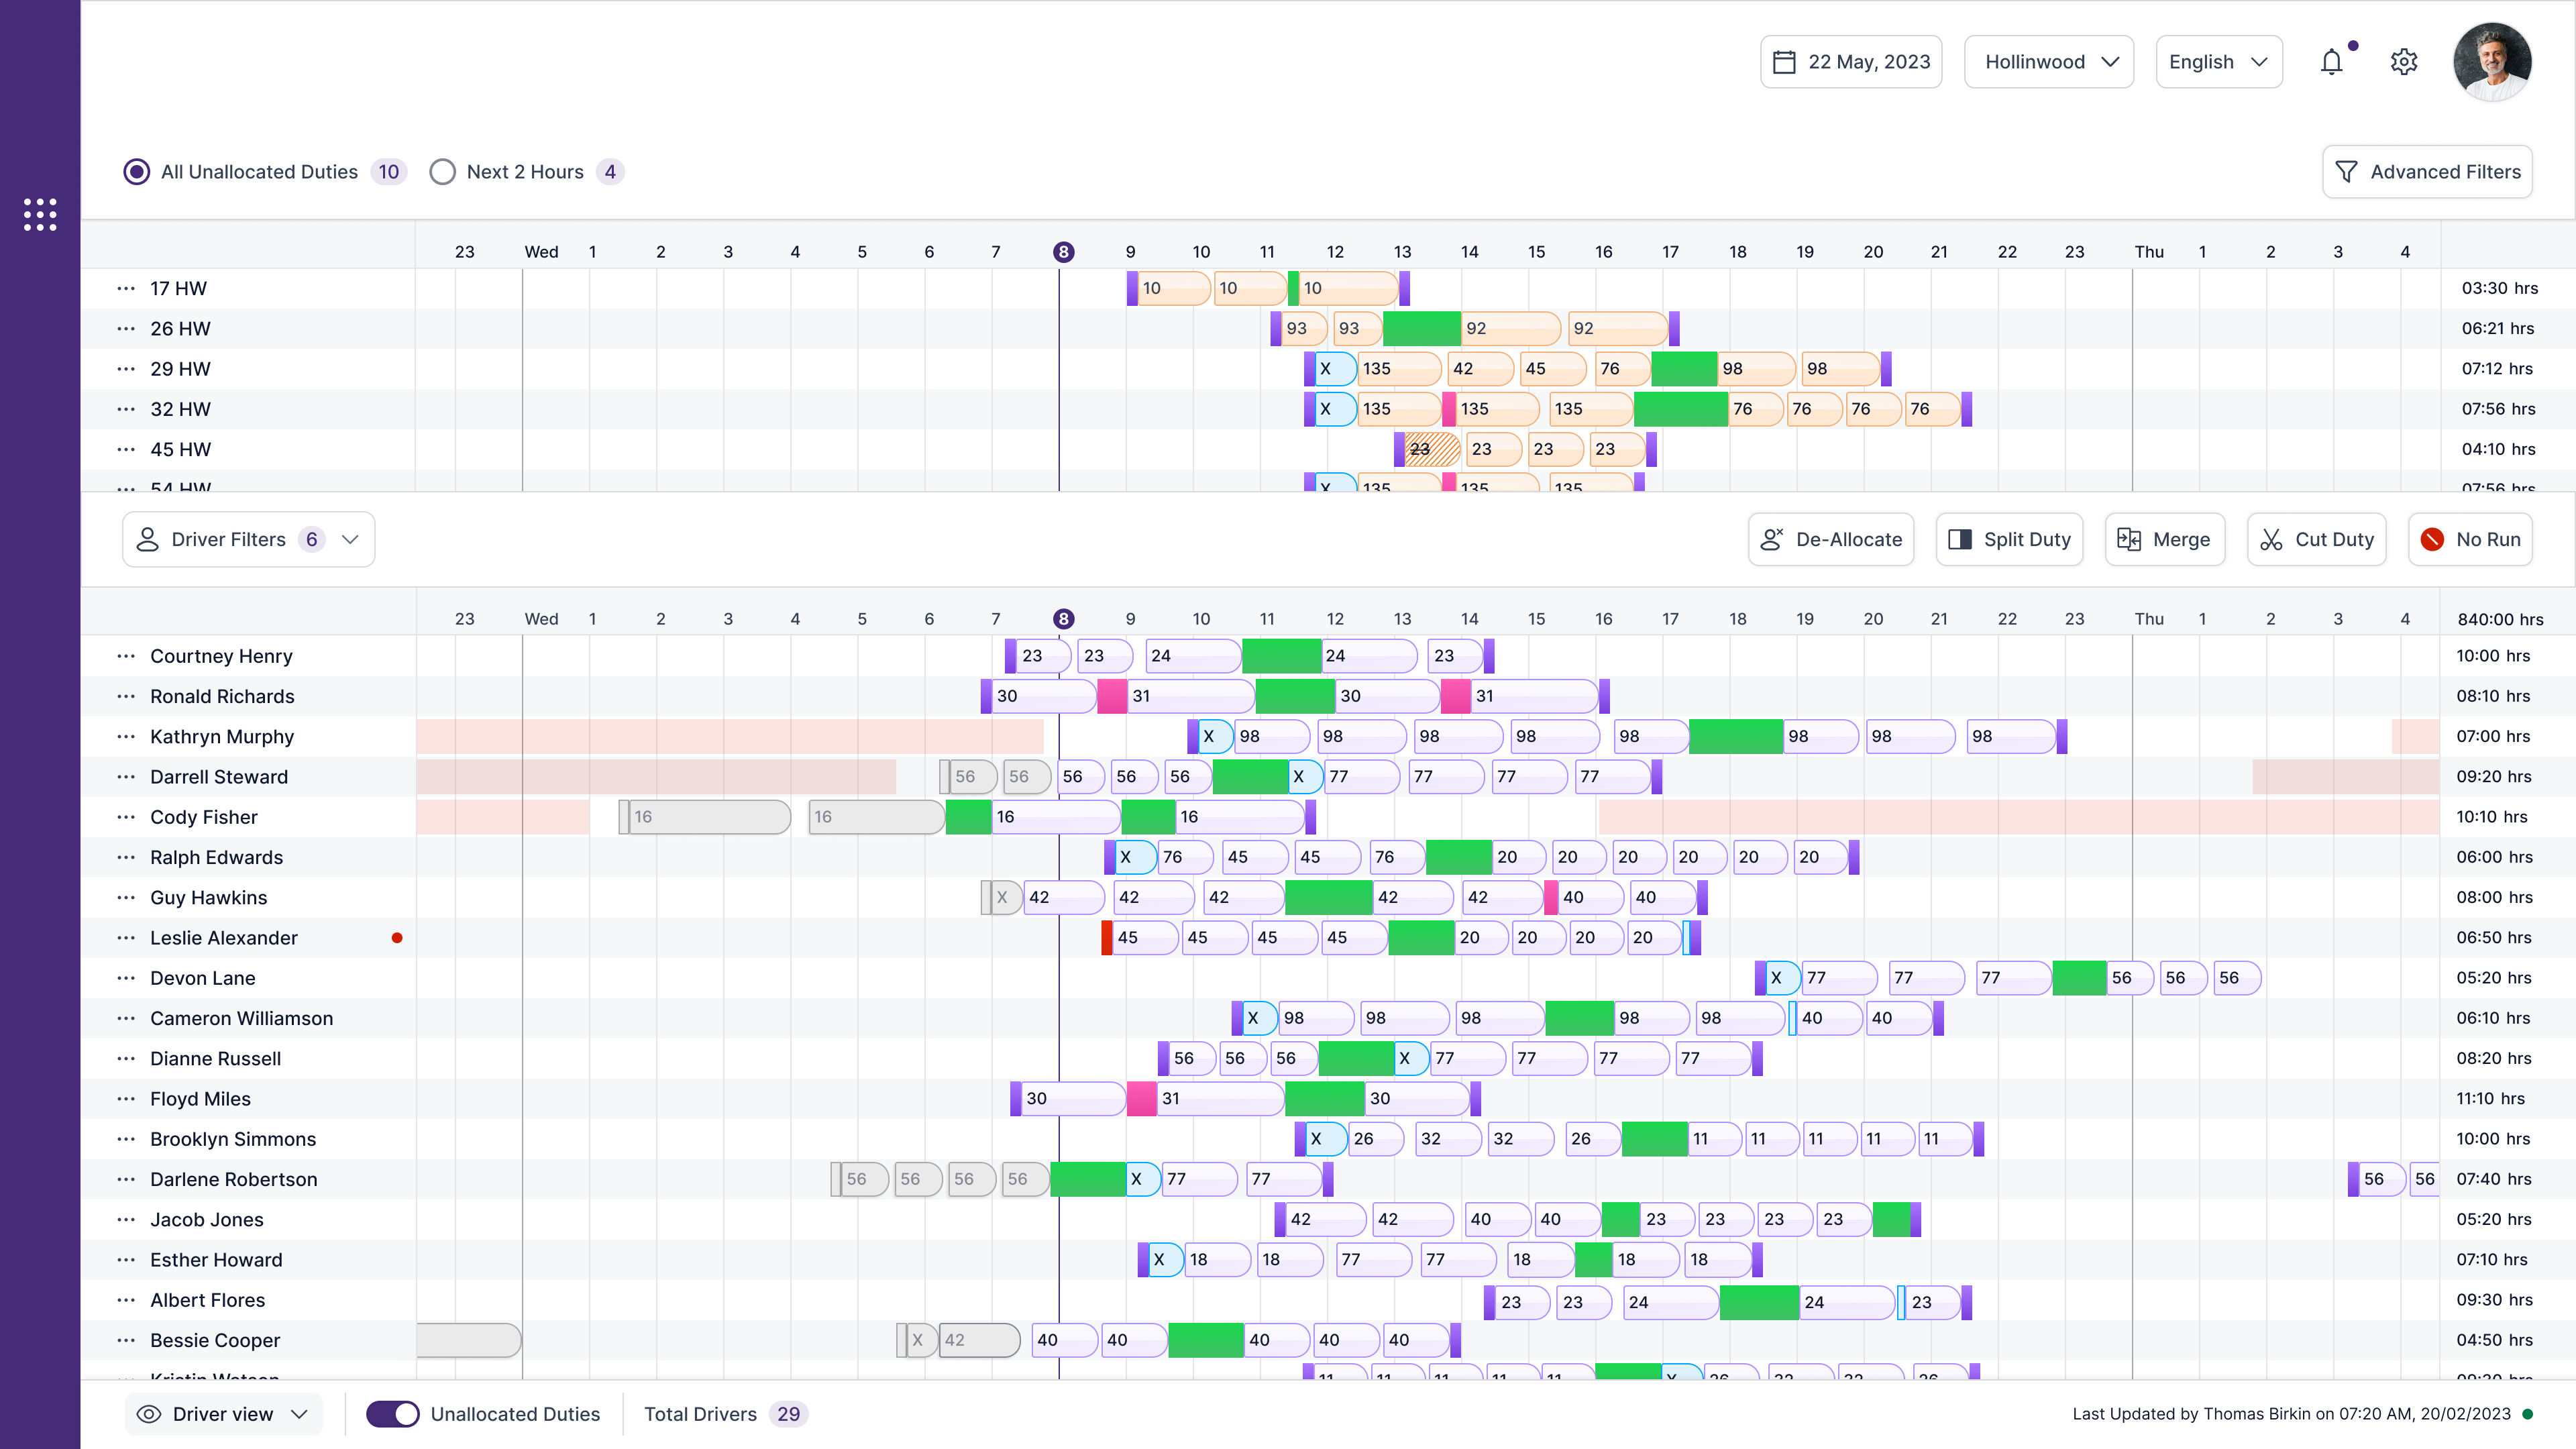
We developed a software by consolidating operational data from various systems into single consolidated view, the platform enables controllers to address on-the-day issues promptly and ensure the delivery of a reliable and quality bus service.
I worked closely with the product team and various departments and visited client sites, where i identified pain points and gathered suggestions. This collaboration led to the design of a software solution that gained significant attention in the industry and attracted new clients.
2. Project Overview
Creat a solution which reduce the need of using multiple systems.
The business identified a challenge faced by some bus operators through client visits and feedback. Operators are currently using multiple software systems to manage daily operations, such as assigning duties to drivers, allocating buses, and managing bus routes. The controllers, who oversee daily operations, and the allocators, responsible for assigning duties and buses, are using different software and communicating manually about any updates or changes. Based on these insights, the business decided to develop a unified solution that integrates all existing software into a single platform, providing a centralized source for managing operations.
We also conducted a thorough analysis of our existing software, compiling a list of features for the new system. Furthermore, the software integrates seamlessly with industry-standard solutions used in control rooms, which eliminates duplicate data entry and enhances data accuracy with real-time updates. This integration provides valuable context, including historical events and driver behaviors, empowering controllers to make informed decisions quickly.
3. User Research
From Client Visits to User Forums
After our initial analysis of our internal systems, we visited multiple clients’ control rooms where they manage their daily operations. During these visits, we closely observed how the teams handle a variety of tasks, such as allocating buses to specific routes, adjusting schedules, and managing real-time changes to services due to various factors, including traffic delays, weather conditions, or unforeseen events like mechanical failures. We also saw how they deal with the challenge of changing or canceling services in response to a variety of issues, such as a shortage of drivers or operational disruptions
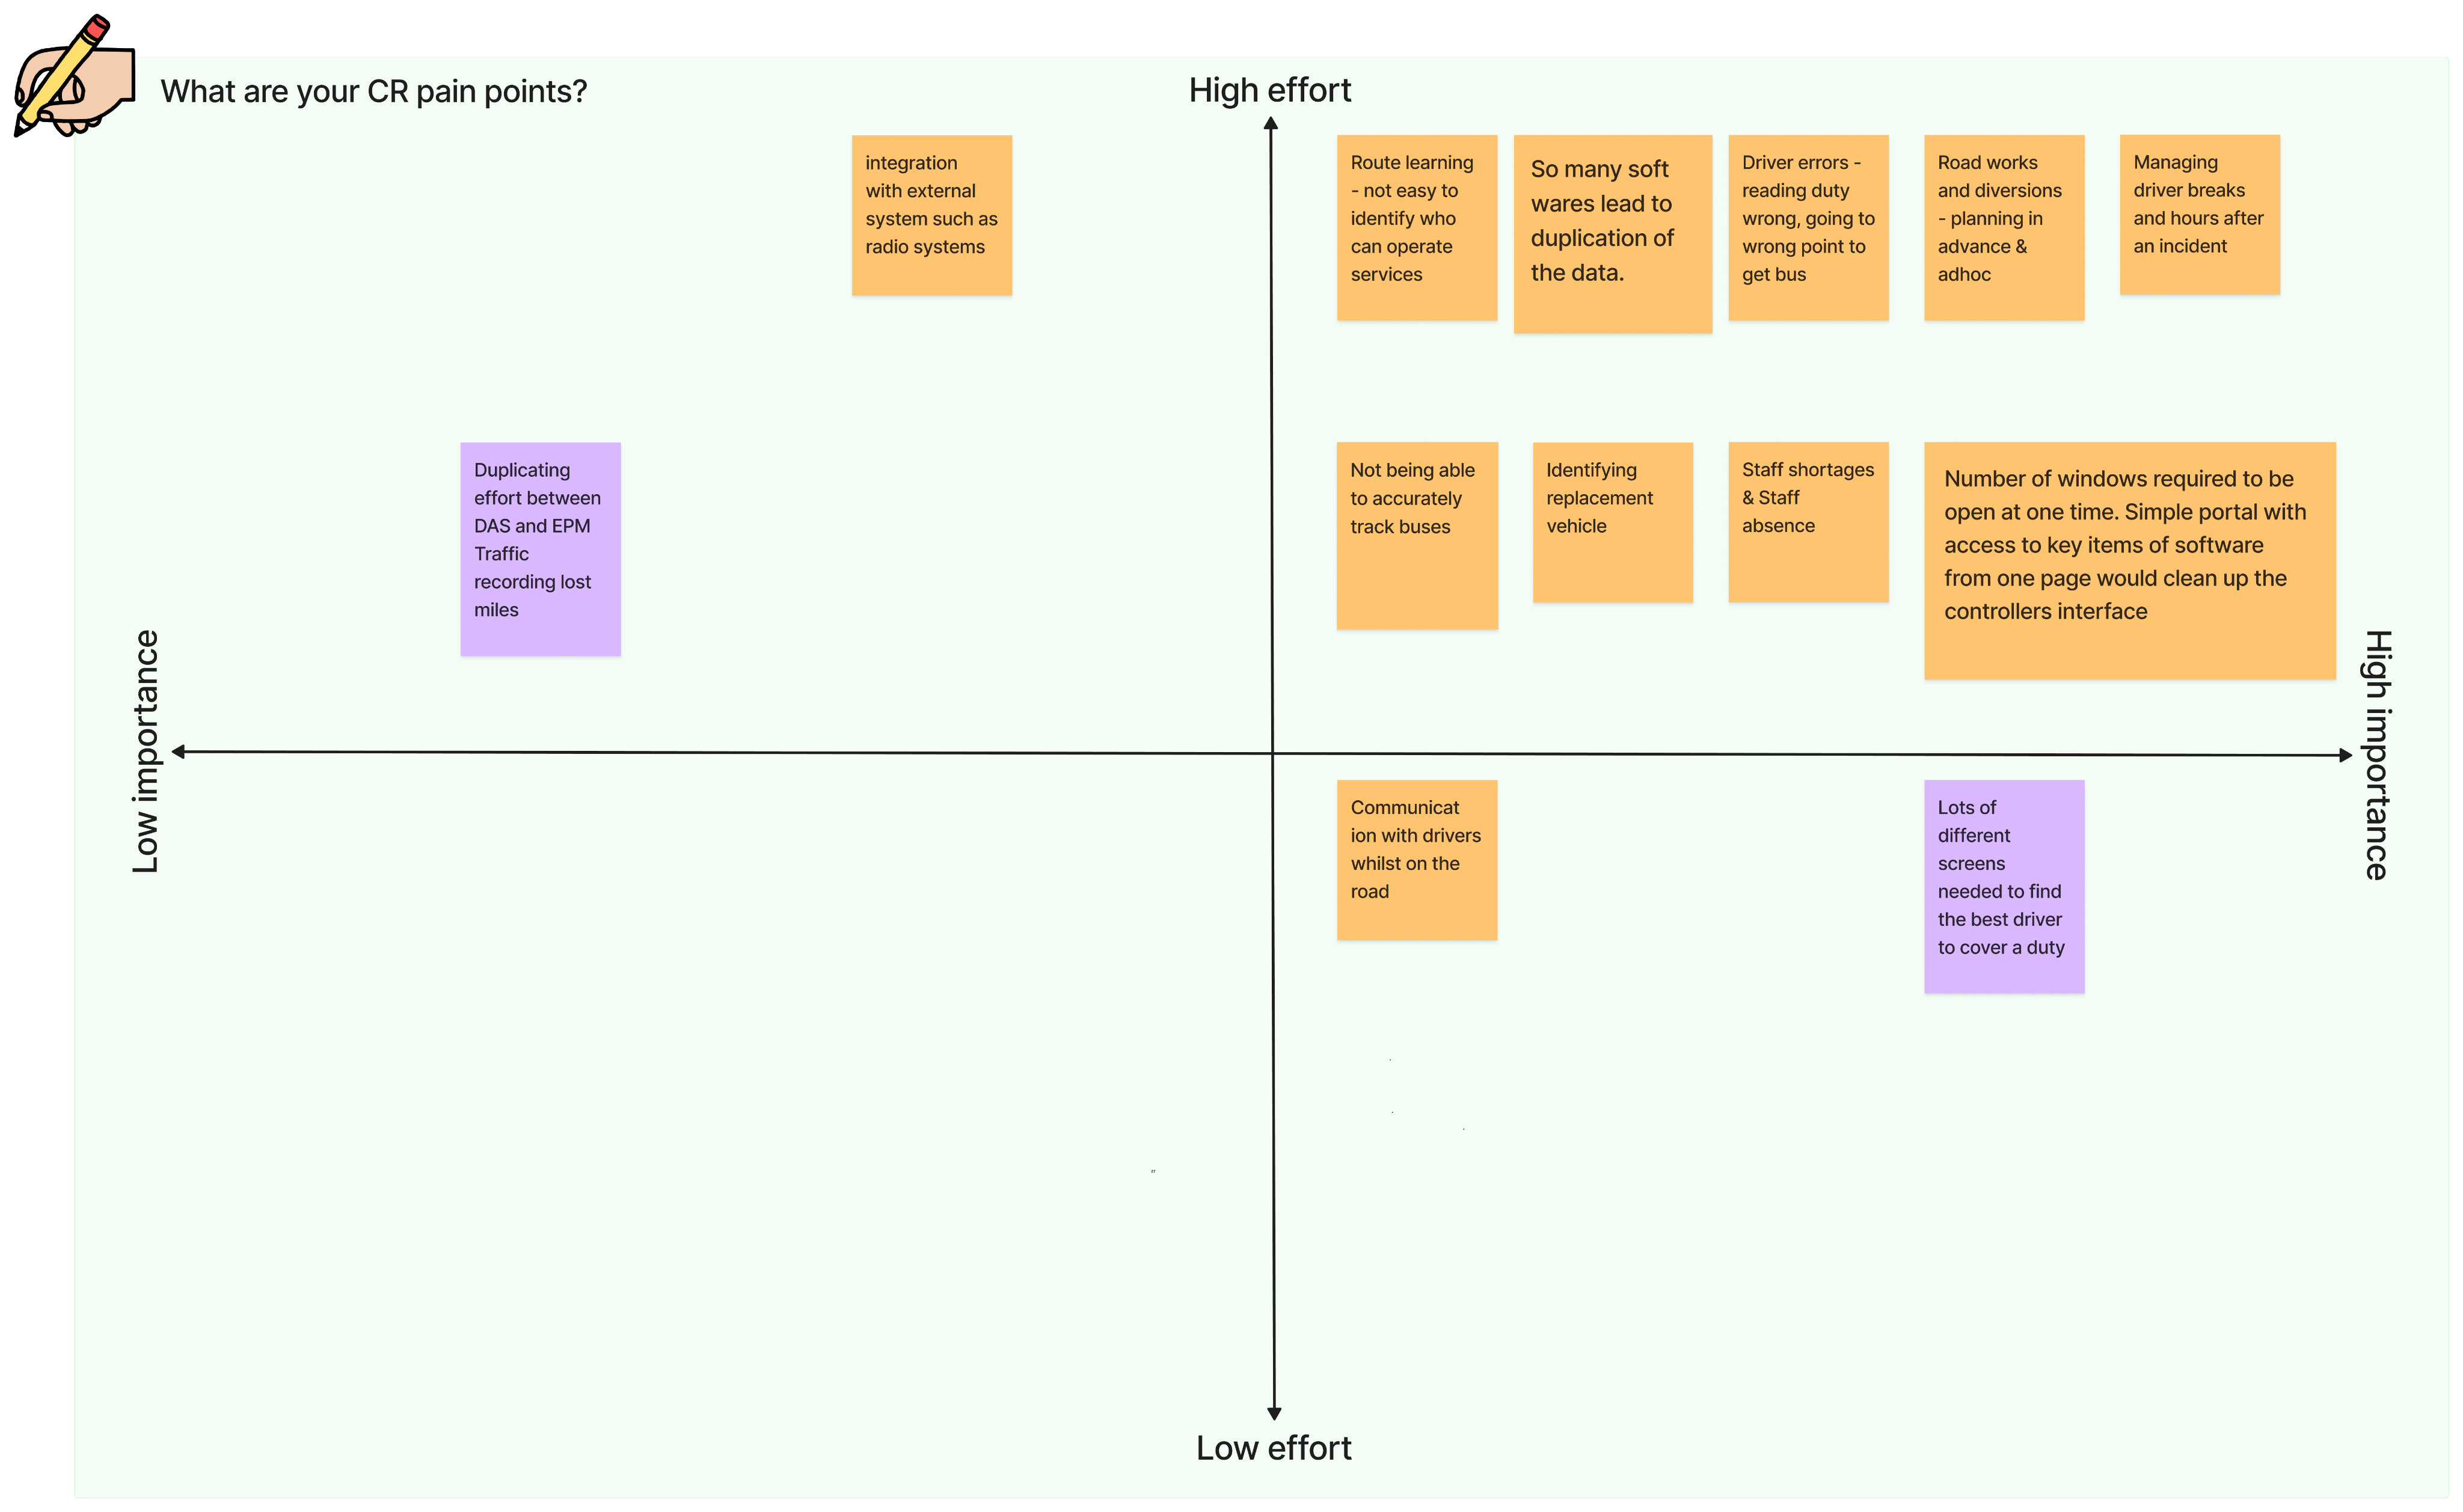
We conducted multiple user forum sessions to better understand the pain points faced by our users. During these sessions, we asked participants to prioritize issues from low to high importance, which helped us identify the features that were most urgently needed. The insights gathered from these discussions allowed us to prioritize features for each sprint, ensuring that we focused on delivering the most valuable solutions first.
4. Visual Designs
Hi-Fidelity mockups & Lots of Components
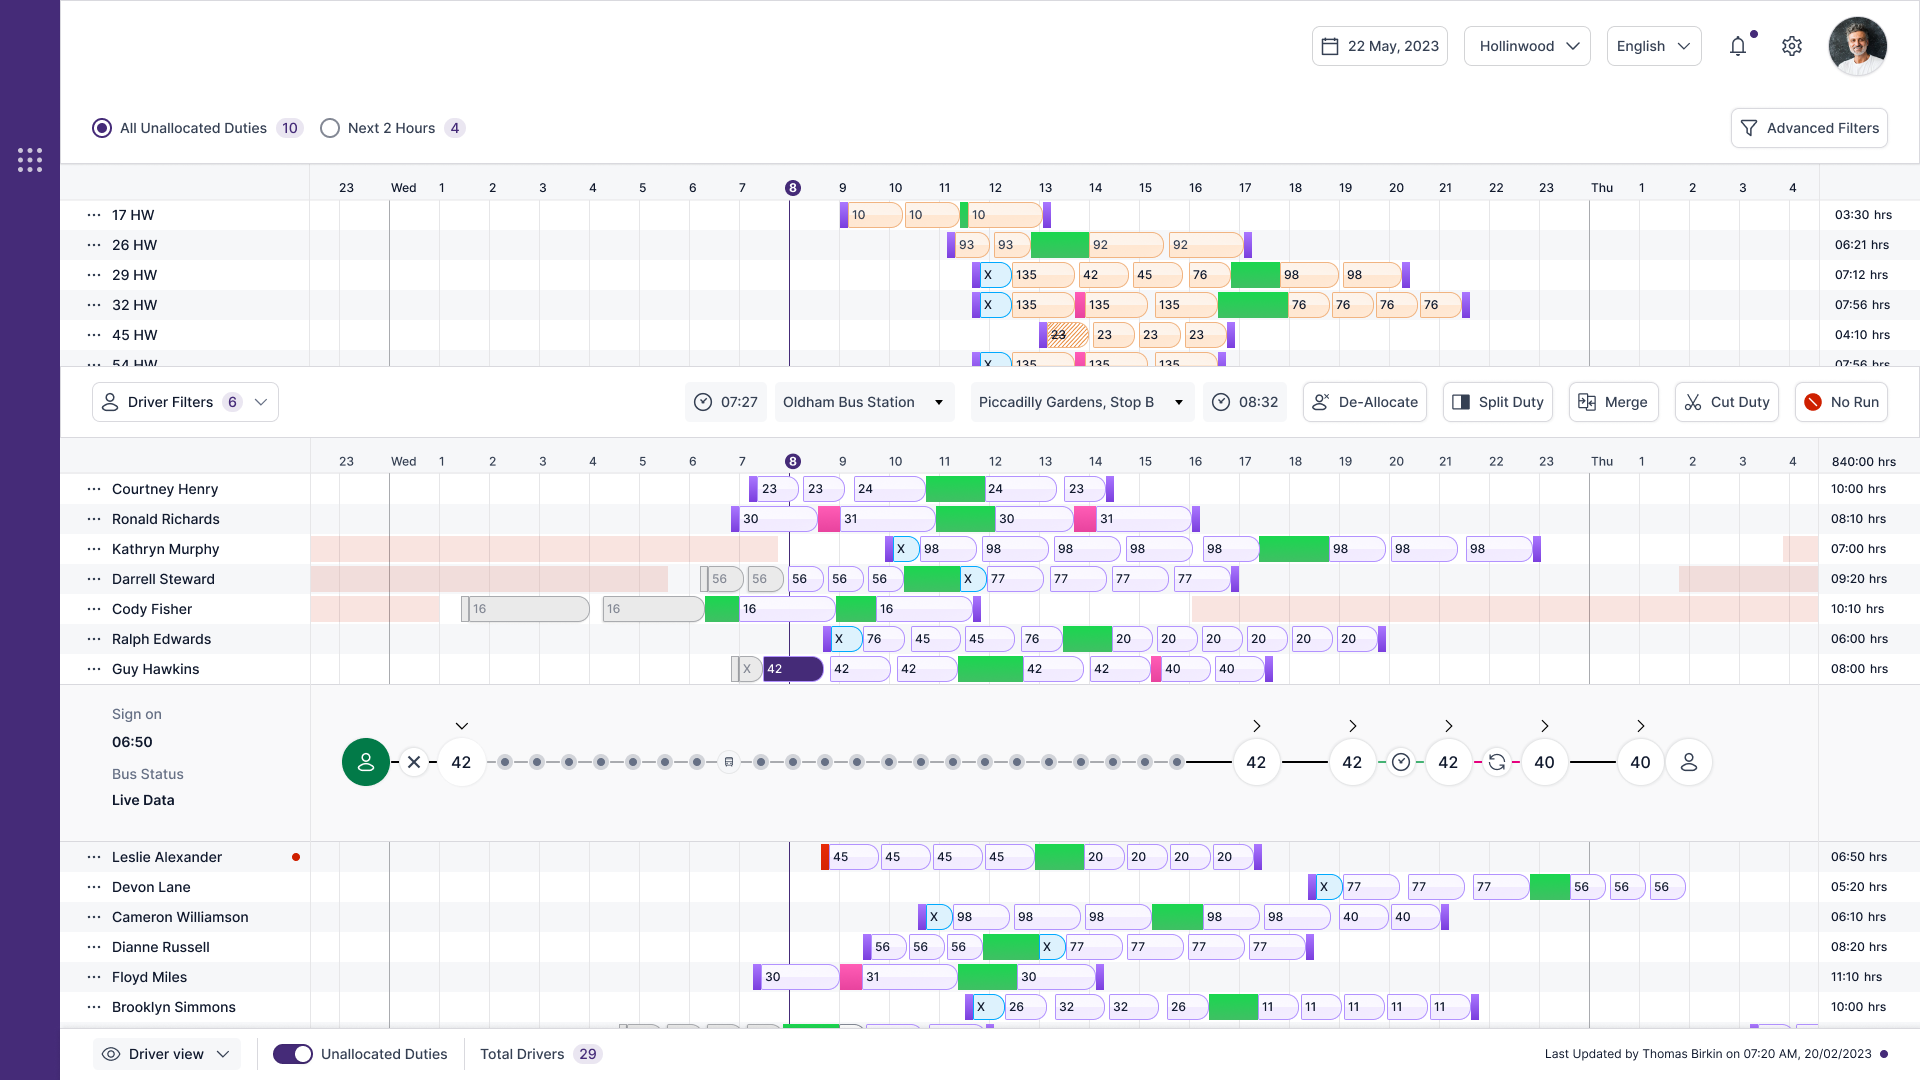
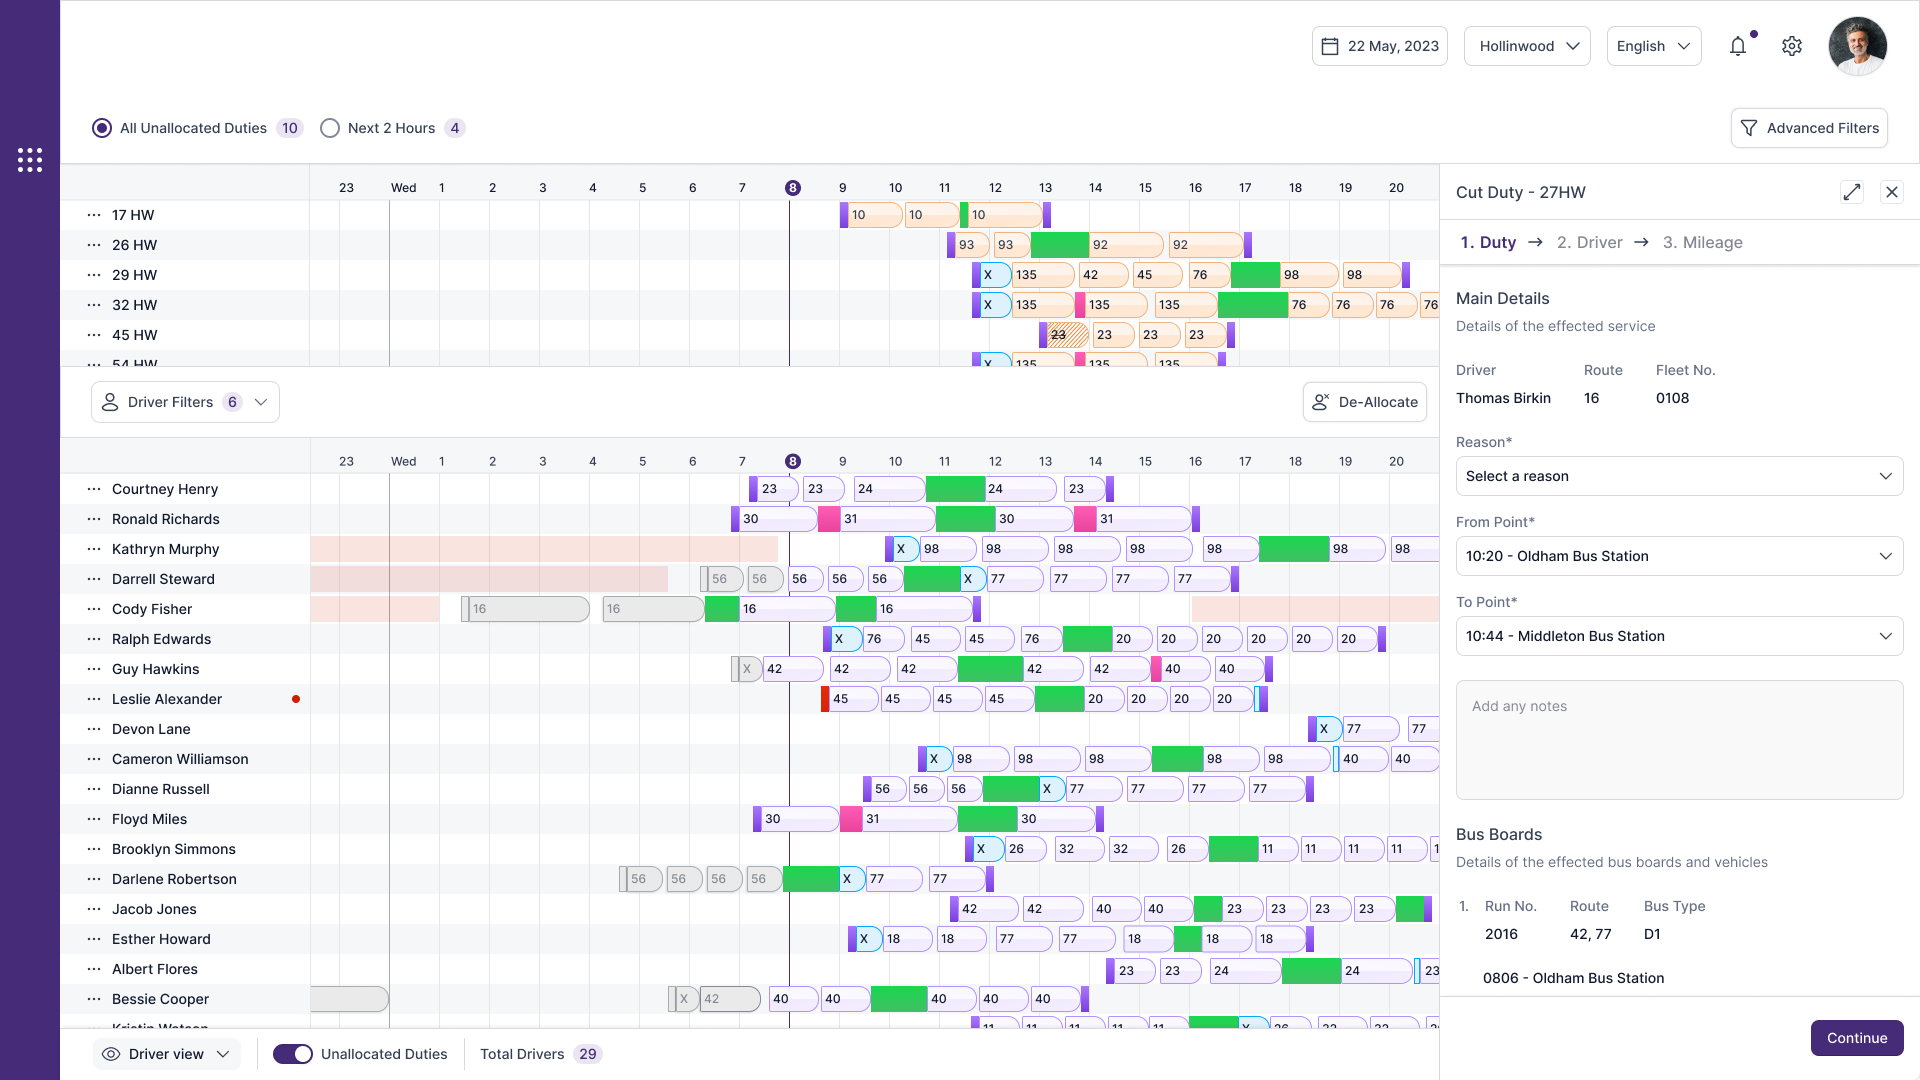
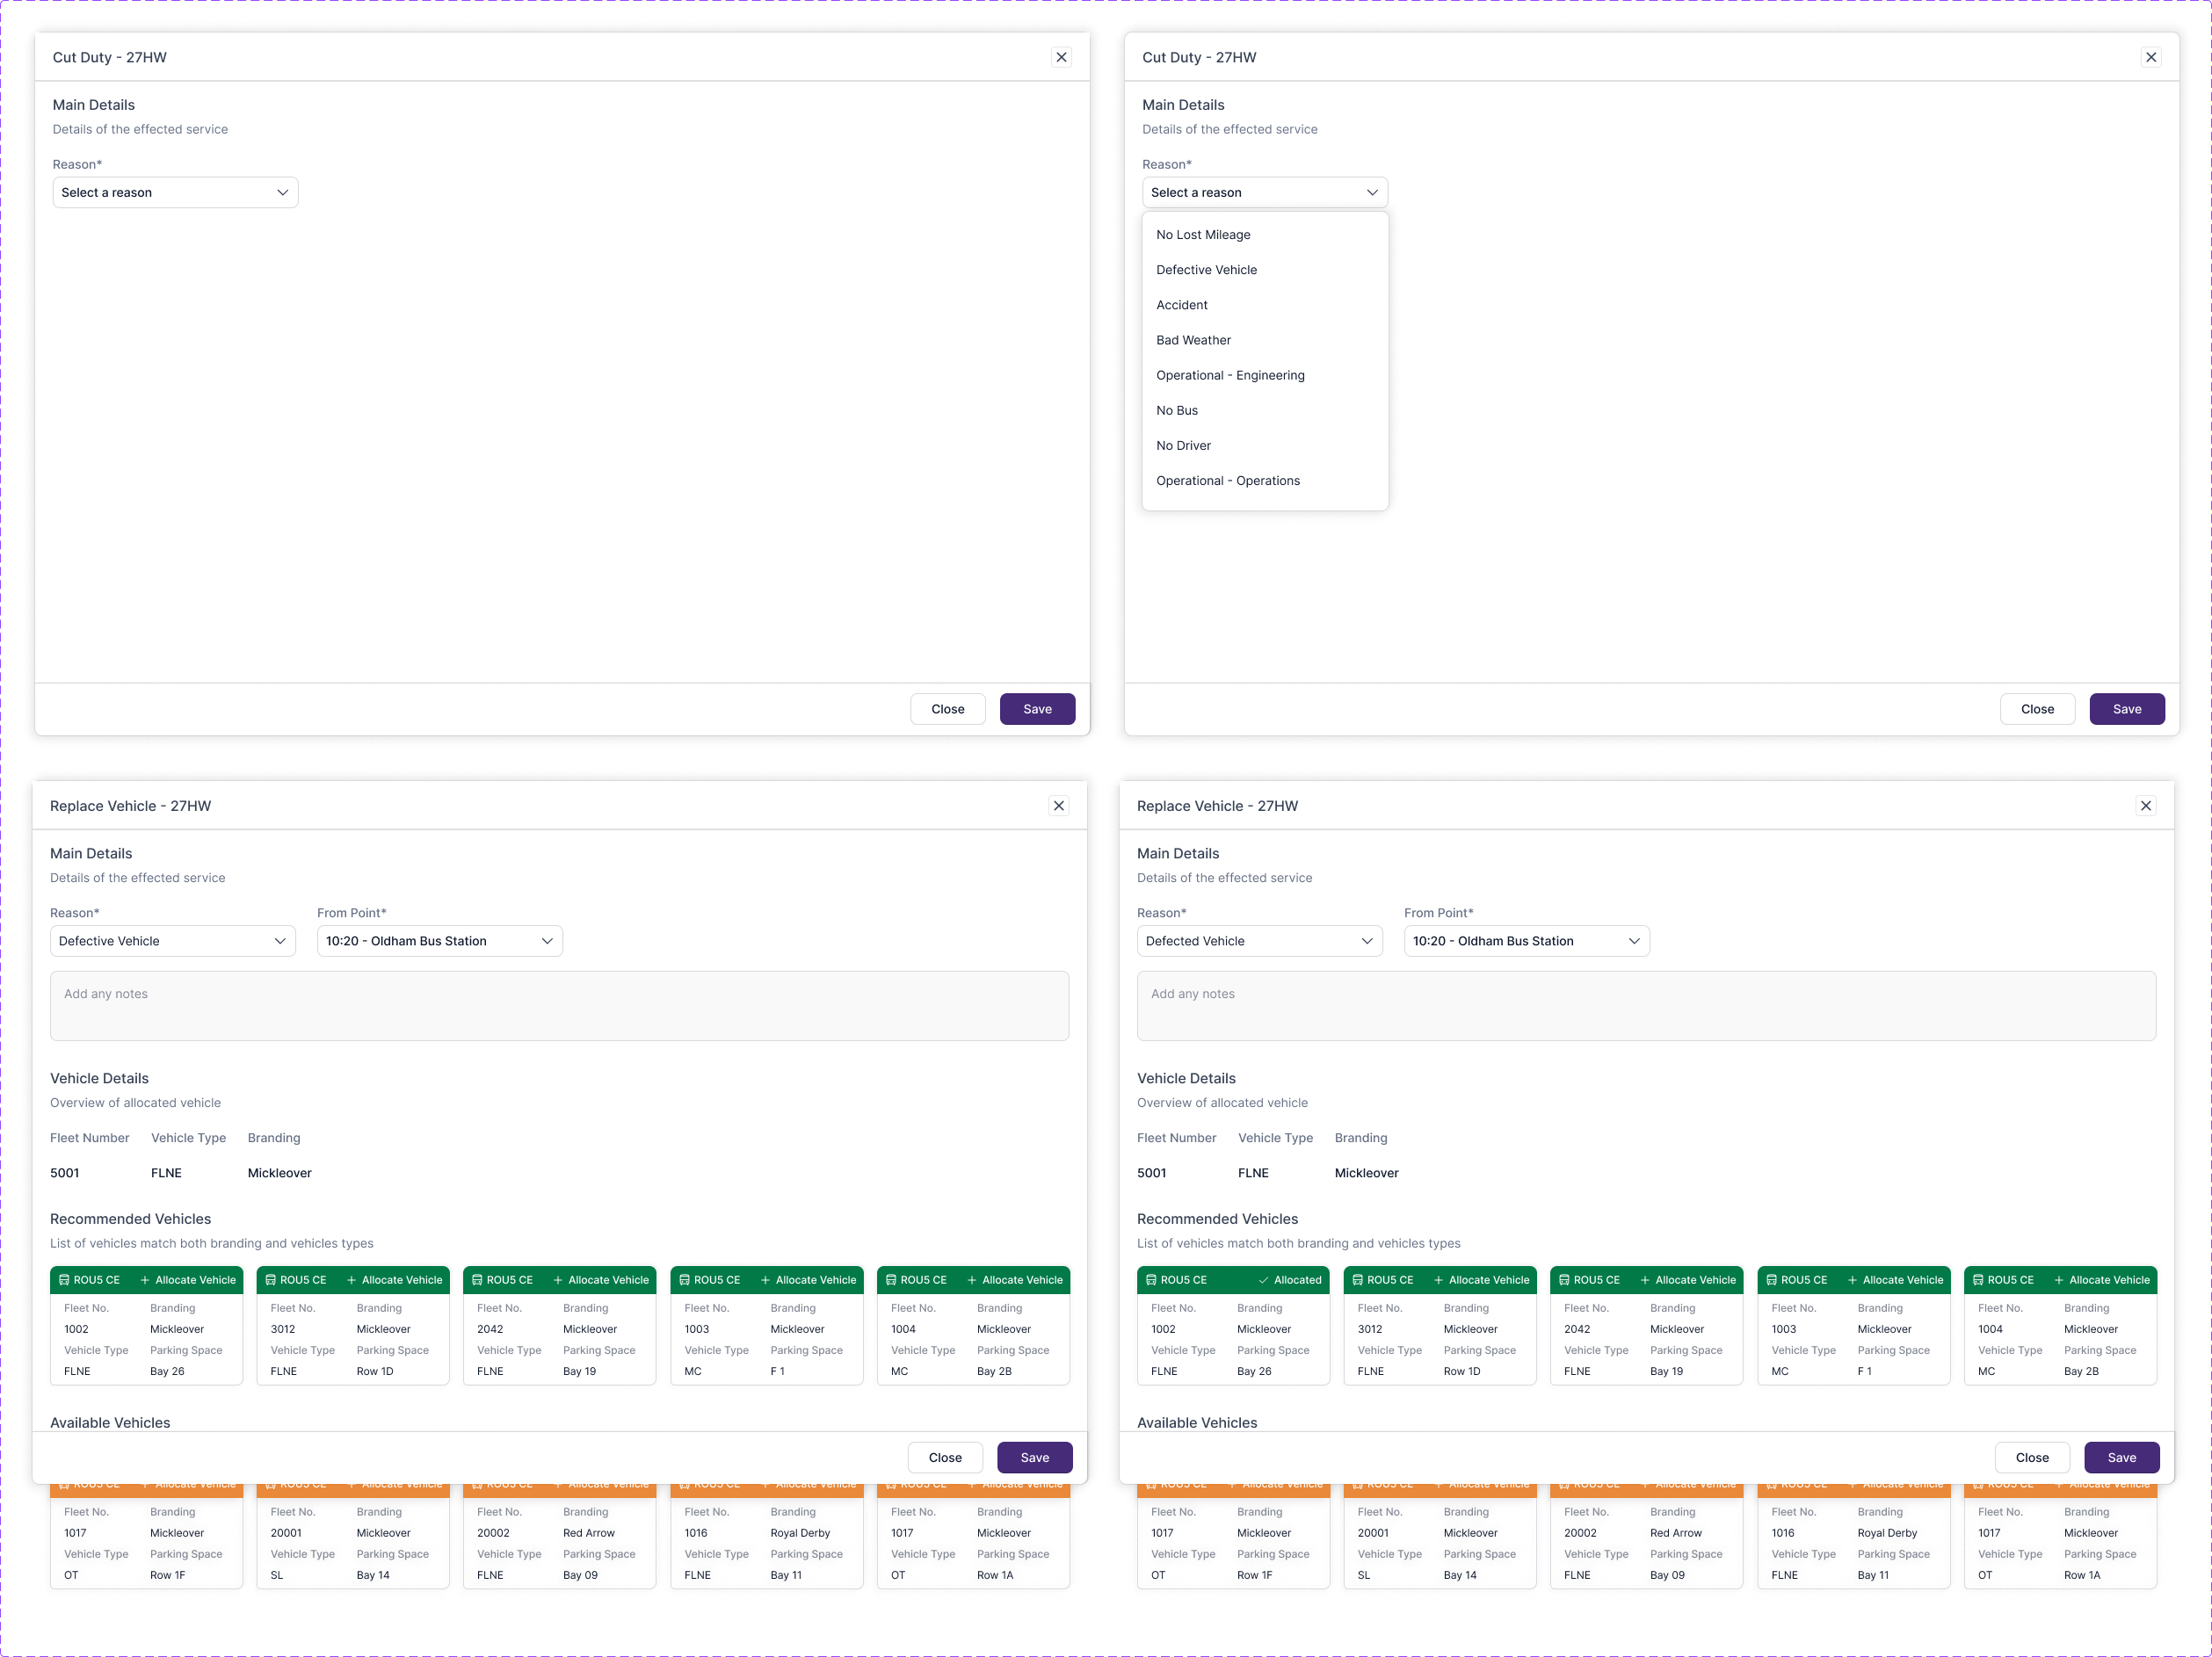
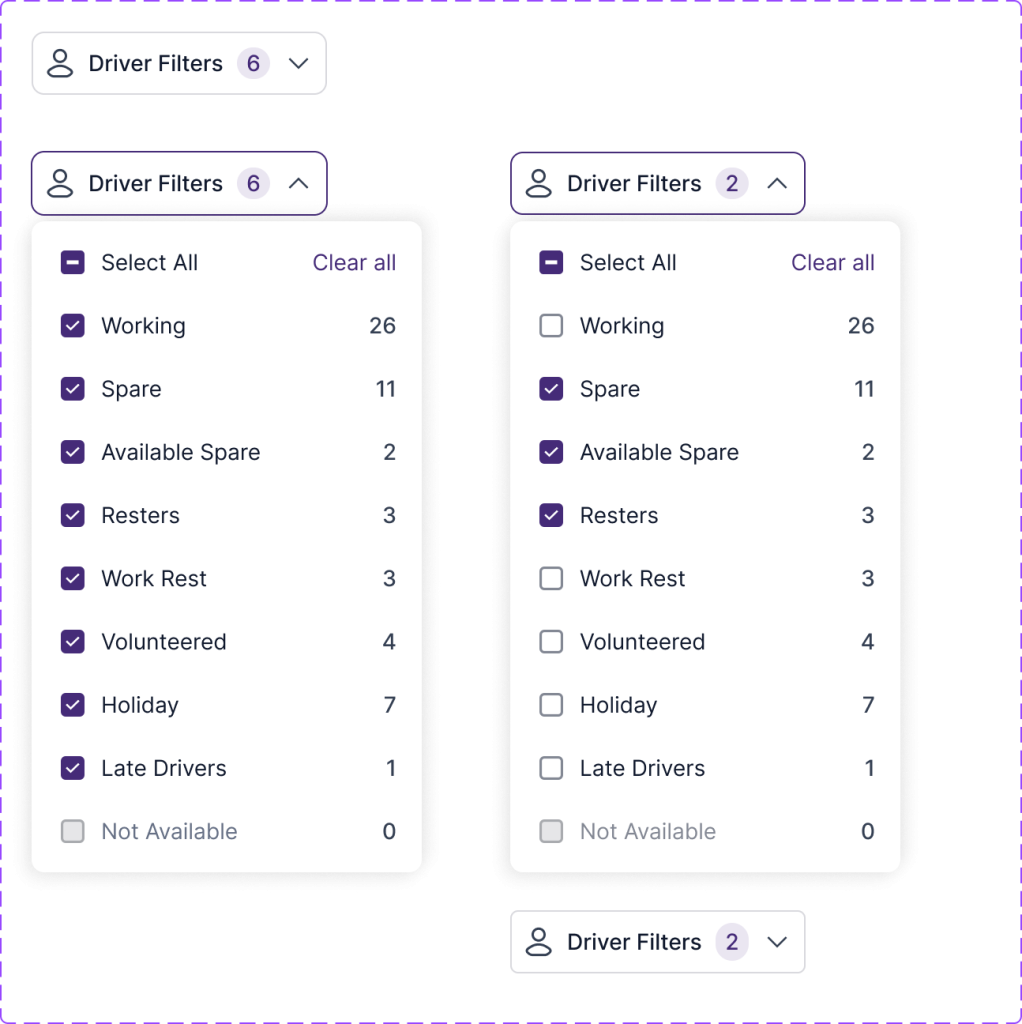
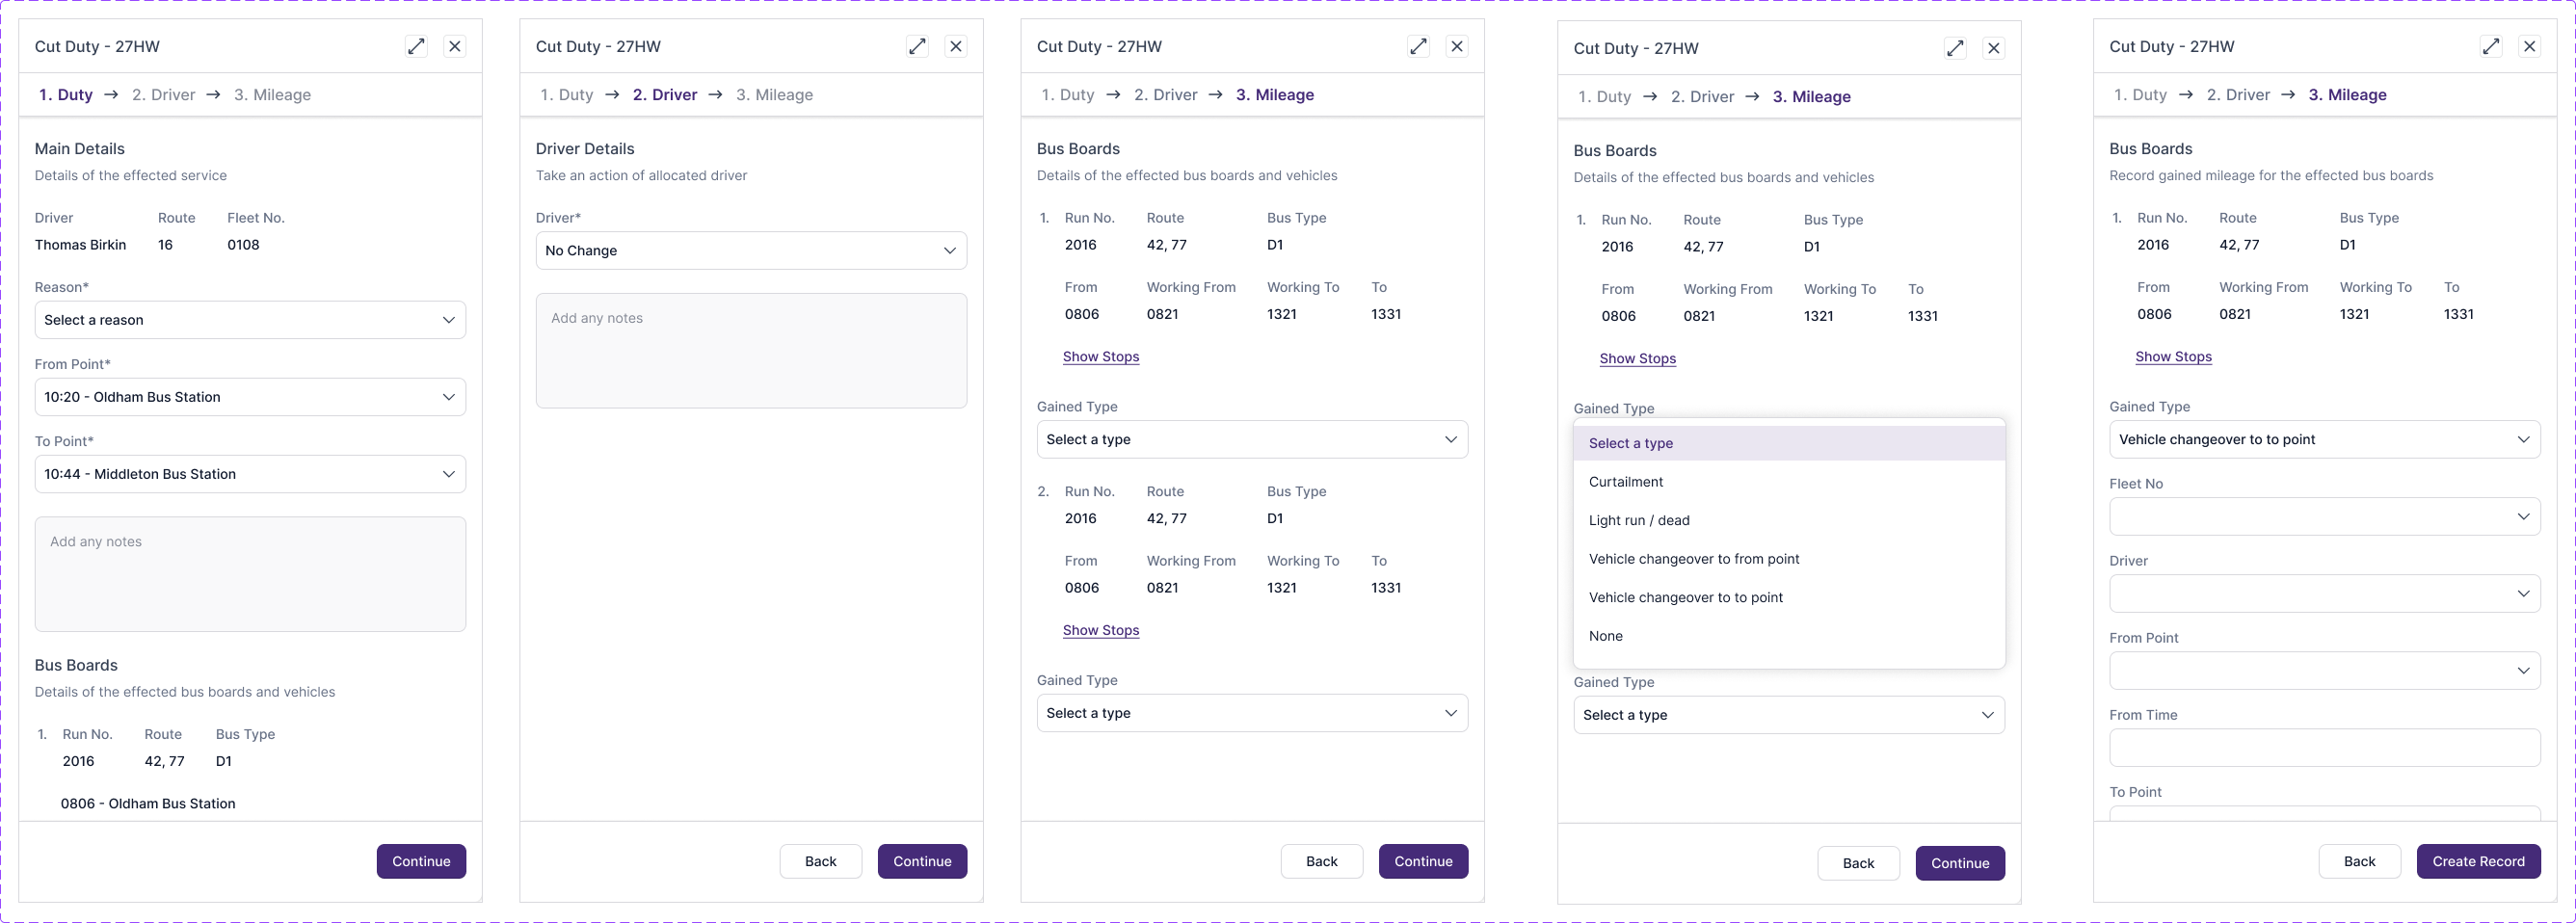
As part of this project, I designed several new components that were previously unavailable in the existing systems. These components were created to enhance the interactivity of the user interface, providing essential touchpoints that guide users through their journey within the application. The components I designed include menu items, filters, modals, and other interactive elements, all aimed at improving navigation and user engagement. By introducing these features, we not only aimed to simplify complex workflows but also to make the interface more intuitive and responsive. Each component was thoughtfully designed to ensure a seamless user experience, enabling users to quickly access and interact with key features, filter and sort information efficiently, and receive important notifications through modals
5. User Feedback
Surveys & Testing
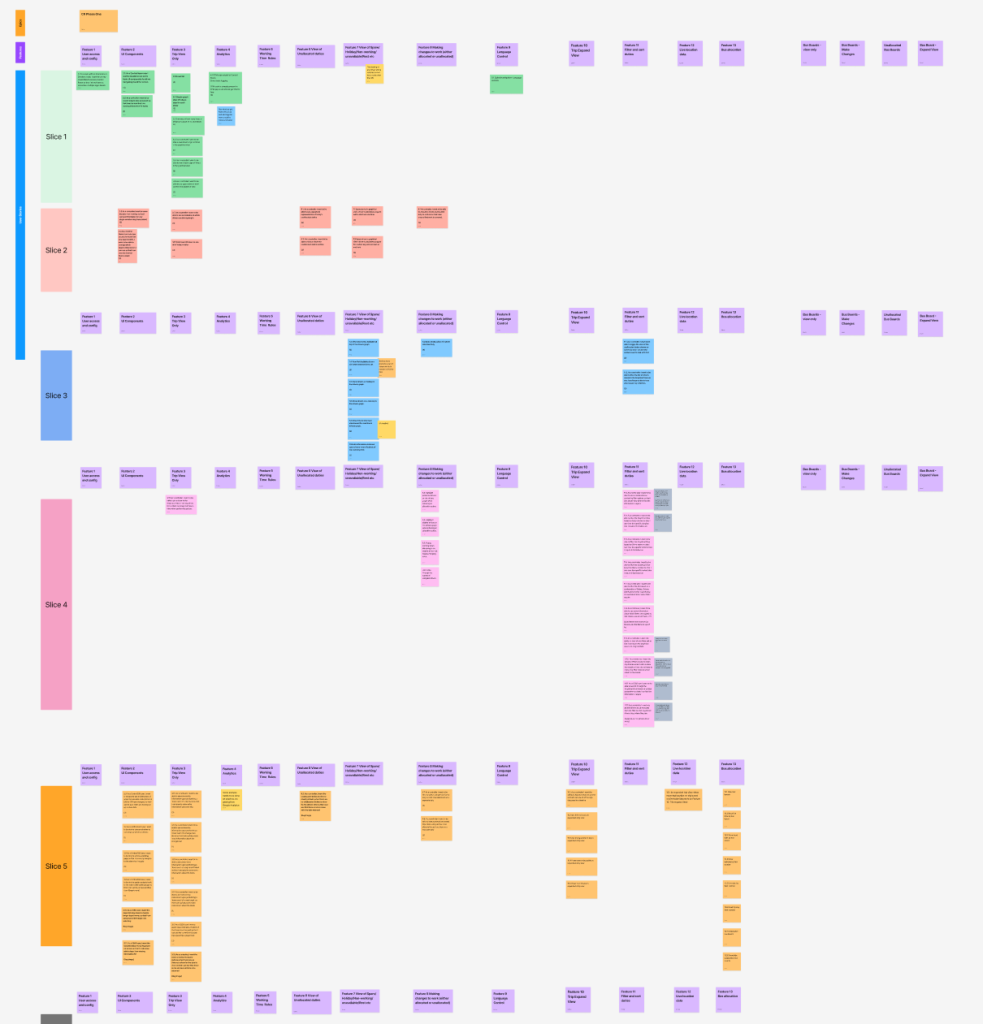
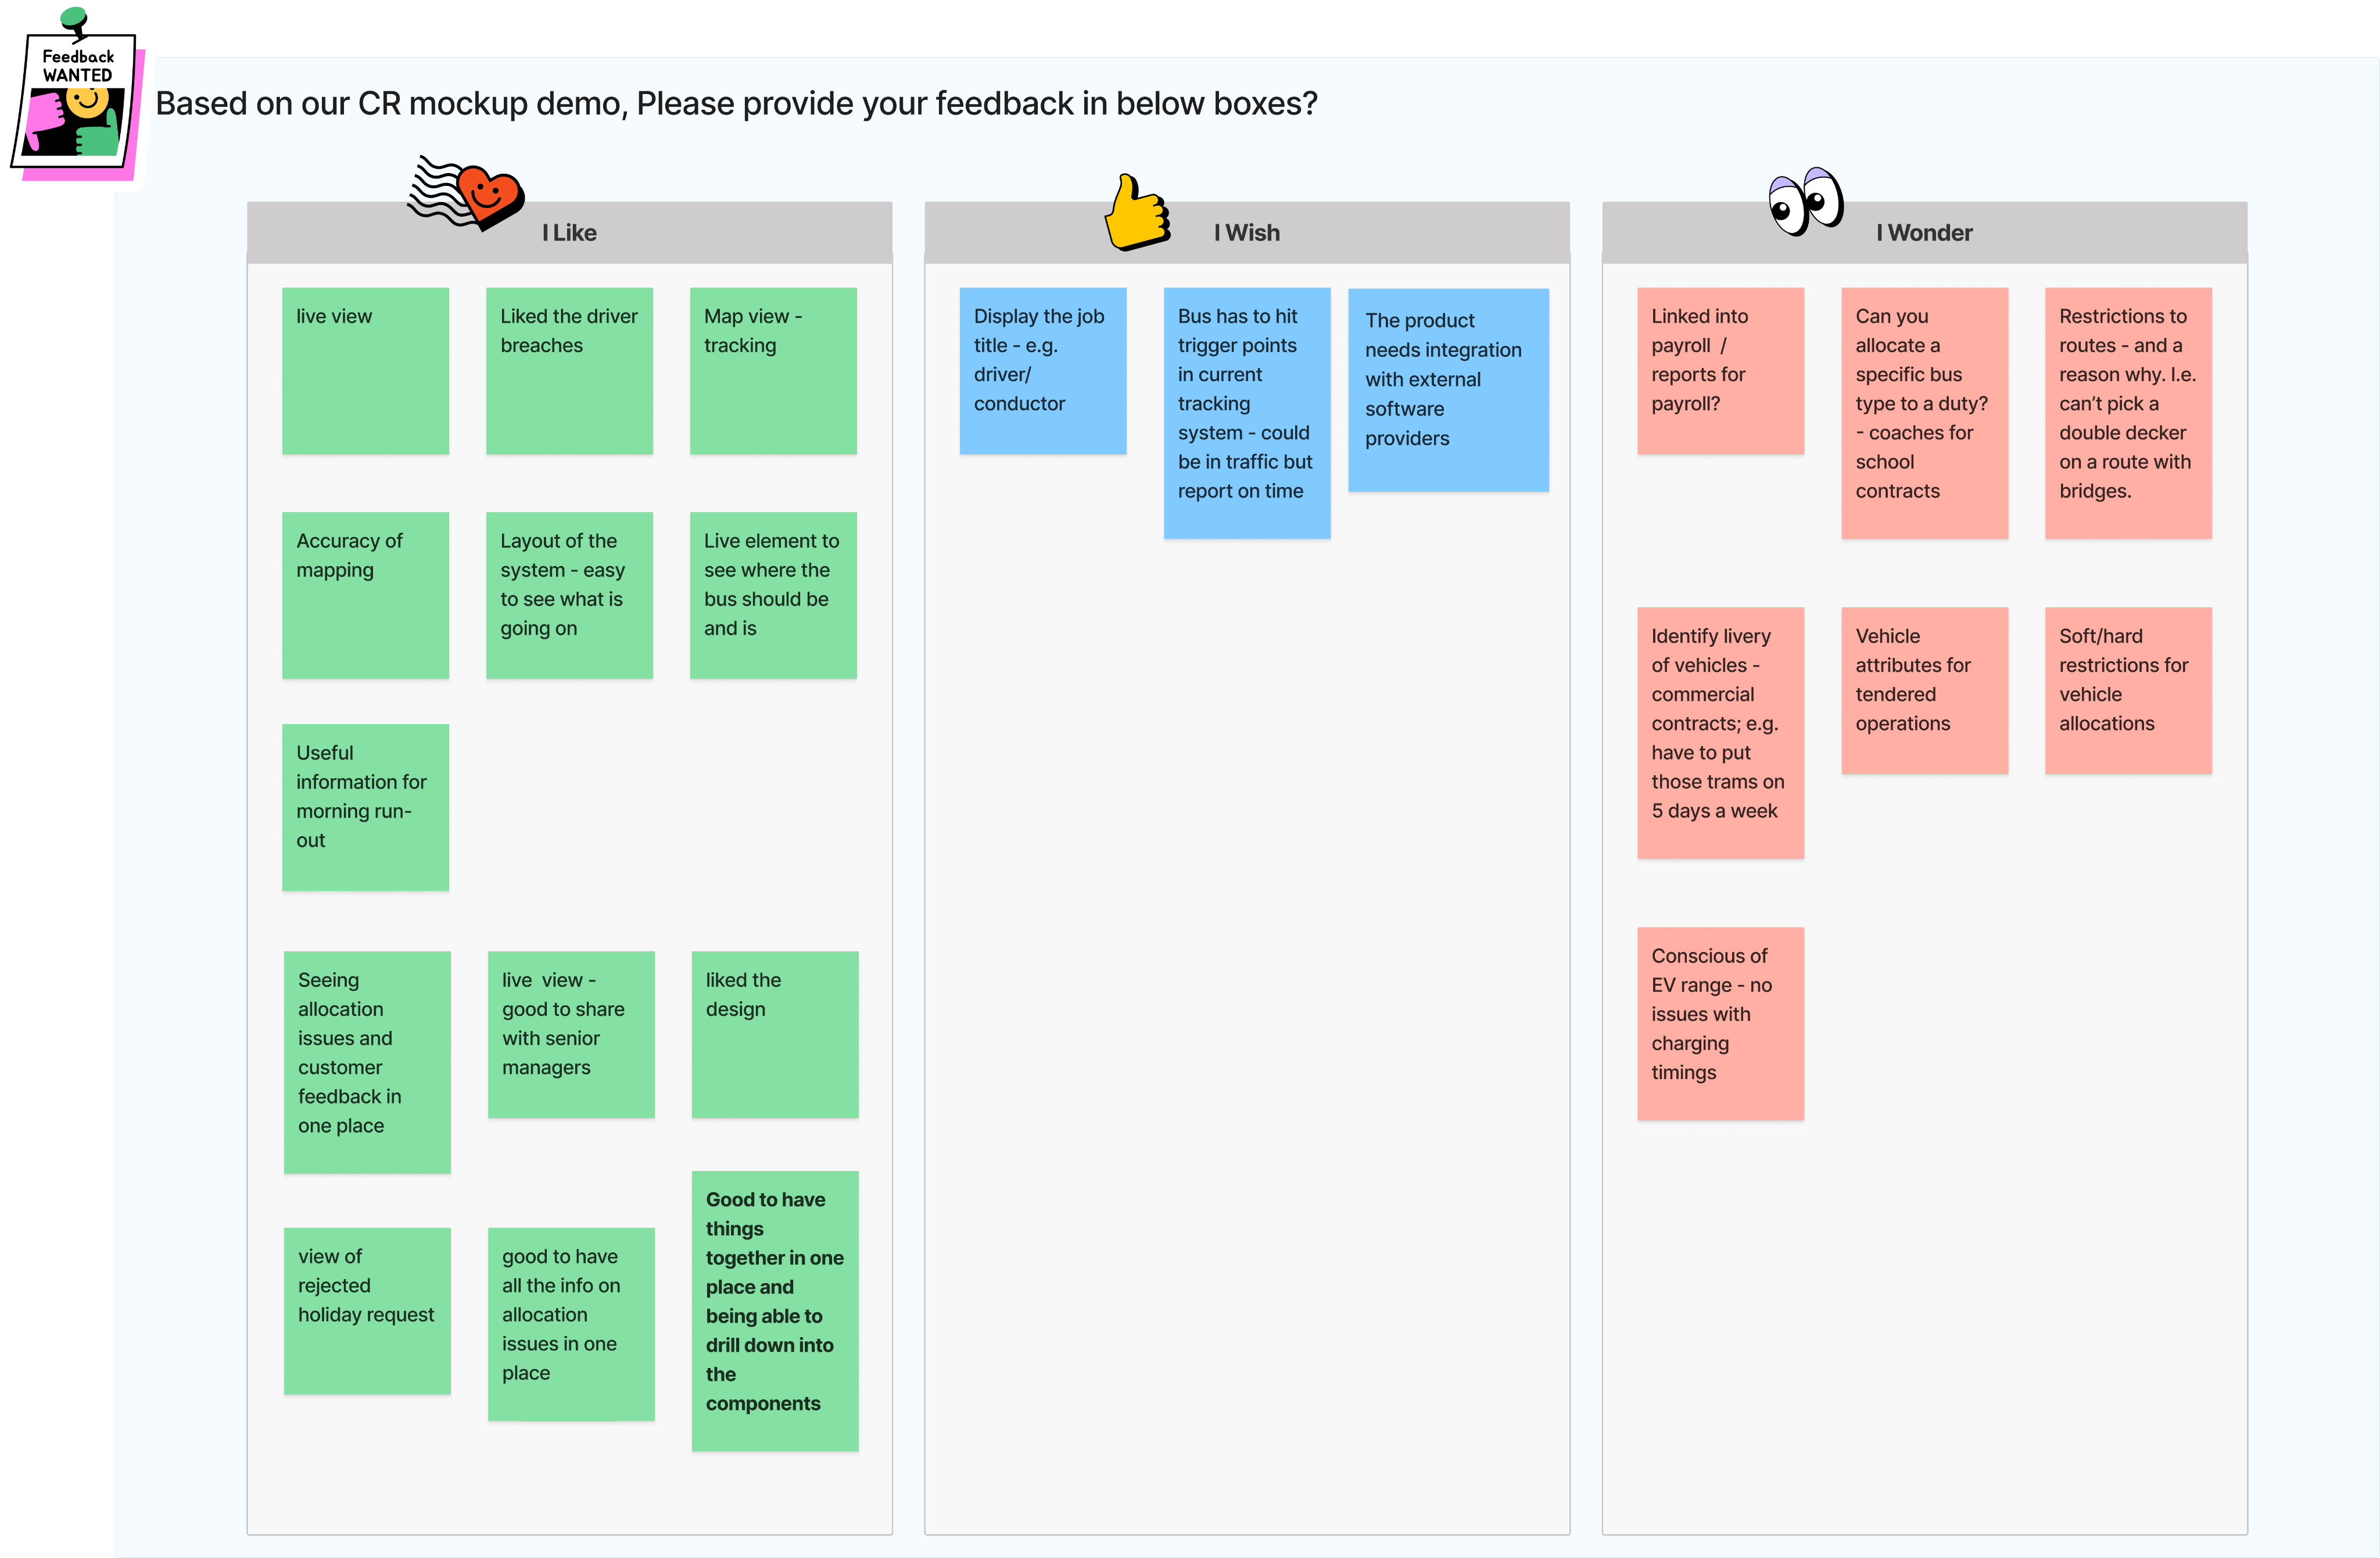
Since the project follows an agile methodology, continuous user feedback session and surveys was critical for planning the scope of each sprint. I worked closely with business analysts to define epics and break them down into actionable features and user stories, which were then assigned to specific sprints. Additionally, the feedback from the forums provided clear guidance on the design requirements for each sprint, helping us ensure that the user interface and experience were aligned with the needs of the users. This collaborative approach allowed us to continuously refine our development process and deliver features that addressed the highest-priority pain points in a timely and efficient manner.
To evaluate the usability and effectiveness of the system, I used Maze to conduct a series of user testing sessions. Each participant was provided with a unique link to access a series of tasks that were designed around different user scenarios. These scenarios were carefully crafted to test specific aspects of the interface, ensuring that the tasks were both representative of the user journey and challenging enough to uncover any usability issues. Throughout the testing process, I closely monitored the participants’ interactions with the system, documenting their performance and capturing key data points. I collected quantitative metrics such as task success rates (measuring how many tasks were completed successfully), misclick rates (tracking how often users clicked on unintended elements), and the average time it took for each participant to complete a task.
6. Interactive Prototype
high-level clickable prototype
I developed a high-fidelity, clickable prototype to effectively demonstrate the software’s functionality to users and stakeholders. This prototype was designed to simulate a realistic user experience, allowing users to interact with the application and explore its key features as if they were using the fully developed system. All features within the prototype were carefully crafted based on continuous user feedback, as well as insights gathered during client visits, ensuring that each element addressed the specific needs and pain points identified during those sessions.
To evaluate the usability and effectiveness of the system, I used Maze to conduct a series of user testing sessions. Each participant was provided with a unique link to access a series of tasks that were designed around different user scenarios. These scenarios were carefully crafted to test specific aspects of the interface, ensuring that the tasks were both representative of the user journey and challenging enough to uncover any usability issues. Throughout the testing process, I closely monitored the participants’ interactions with the system, documenting their performance and capturing key data points. I collected quantitative metrics such as task success rates (measuring how many tasks were completed successfully), misclick rates (tracking how often users clicked on unintended elements), and the average time it took for each participant to complete a task.
7. Product Demo
